
Connecting a CAN bus device to Azure IoT Hub nodeG5 Quick Start Guide:
This quick start guide is for engineers to quickly get from the wire up, to collecting data and visualising their remote field equipment on Azure IoT Hub & Power BI using the nodeG5 Edge IIoT gateway.

What You'll Need To Get Started
-
NodeG5 Edge CANbus-to-Azure IIOT Starter Kit
-
1 x NodeG5 CAN Bus Industrial 4G/LTE Gateway with Azure IoT client
-
1 x CAN Bus device (OZEN Elektronik J1939 ECU Simulator)
-
1 x I/O Connector
-
1 x CAN Bus cable
-
1 x 24VDC power supply 100-240VAC
-
1 x cellular antenna (2m wire length)
-

Learn More: Click Here
You will also need the following
-
1 x micro SIM card with 3G/4G data enabled – please also get its APN setting from provider.
-
A Microsoft Azure account
-
optional: Test switches or load (max 230V 8A, e.g. a 12V indicator) if there is no field equipment ready.
Note: As per writing, you can get a one-month-free-or-USD200-credit for Microsoft Azure & Power BI to help with testing your concept. Click here to get your Free Azure Trial
Collecting CAN Bus & Modbus interface devices
For collecting data from CAN Bus & Modbus interface devices, LUA or BASH scripts can be easily written to poll any data that is accessible over CAN, Ethernet or RS-485/232 interfaces. The data can then be put into a JSON format that can be processed by Stream Analytics query in Azure.
Let's Get Started:
1. Design Planning
It’s usually good practice to start by mapping out the devices you want to monitor, e.g. a vehicle ECU, switch or a sensor in a network diagram.
2. Wire Up
This section describes how to wire up the OZEN Elektronik J1939 ECU simulator included in the starter kit to the nodeG5 Edge IoT Gateway.
Before you begin wiring, make sure to insert an active SIM card into the gateway & connect up the antennas.
Step 1: Wire up the J1939 CAN Bus ECU to the Gateway.

We will start by connecting the devices together. You will need to refer to the respective user manuals for the pin out configuration of each device. The above diagram shows the signal connection from the OZEN board to the CAN Port E of the nodeG5 IoT gateway using a shielded twisted pair cable.
3. Setting up the nodeG5 IoT Gateway
3A. Log into the gateway's web console.
When you have also connected up your PC to the nodeG5 [ETH0 port], log into the web console [192.168.1.1].
By default the username is admin and password is node12345
3B. Configure the cellular 4G settings
In our <QuickStart> tab, key in the APN details you got from your SIM card operator.
Then to confirm the settings, click the UPDATE button.
3C. Configure the Serial Port Settings
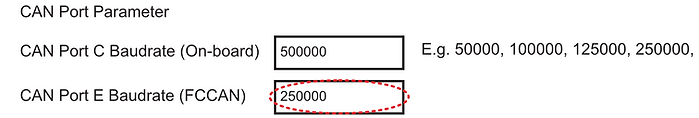
Got to <Port Settings>. Configure the serial port parameters so that it matches with the settings on your CAN device.
Since the OZEN J1939 ECU Simulator communicates using a 29-bit protocol and 250000 bps baud rate, we have configured the nodeG5 as below.
Remember to confirm the settings by clicking the UPDATE button.
3D. Mapping out the data parameters to collect
Next, we will map out the individual sets of data that we want to collect from the ECU. Because different makers of CAN devices will utilise different Parameter Group Number (PGN) settings, if we want to be brand agnostic for cost or product feature reasons, we need to find a universal way to detail the instructions to the gateway. On top of that, data formatting requirements are also different between each cloud platform. This adds to the need for a nimble approach.
Without engineering codes from scratch, a simple but flexible method is to map the parameters we want to monitor onto a configurable file known as an 'iotasset' that's read by the gateway. The example below shows how the "engine coolant temperature" parameter can be translated from the OZEN device user manual to our J1939 iotasset.json format template.
We begin by obtaining the below PGN info from the product's user manual.


When we will follow the J1939 iotasset.json format template to configure the instructions for polling "engine coolant temperature" to the gateway on a simple program like notepad, we get the following results. I have also added samples for other data such as 'engine rpm' and 'vehicle speed' done using the same process.
{
"CANBUS":[
{
"Key":"J1939EngineCoolantTemp",
"IOTMODE":"1",
"CANBUSTYPE":"J1939",
"CANPORT":"canE",
"CANPGN":"FEEE", #"FEEE" is the PGN 0xFEEE (65262 decimal)
"CANSA":"00",
"BYTESTART":"1", #our response data is located at start byte position 1
"BYTECOUNT":"1", #our response data has a length of 1 byte
"DATATYPE":"UINT8",
"SCALEMUL":"1", #we match AWS requirements by applying a multiplier of x1
"SCALEADD":"-40" #we match AWS requirements by putting an offset of -40
},
{
"Key":"J1939EngineRPM",
"IOTMODE":"1",
"CANBUSTYPE":"J1939",
"CANPORT":"canE",
"CANPGN":"F004",
"CANSA":"00",
"BYTESTART":"4",
"BYTECOUNT":"2",
"DATATYPE":"UINT16HL",
"SCALEMUL":"0.25",
"SCALEADD":"0"
},
{
"Key":"J1939VehicleSpeed",
"IOTMODE":"1",
"CANBUSTYPE":"J1939",
"CANPORT":"canE",
"CANPGN":"FE6C",
"CANSA":"00",
"BYTESTART":"7",
"BYTECOUNT":"2",
"DATATYPE":"UINT16HL"
}
]
}
Now that you have configured your device configuration file, we can update it to your nodeG5 gateway securely over the air. The gateway HTTPS connected web console must be accessible, if you do not have an Internet connection, you can follow the alternative steps here).
Go to the <Management> tab in the web configuration menu. Enable the SSH option (see below) and click the 'UPDATE' button to save your settings. Then reboot the gateway.

Then log in again, go to the <IOT Hardware> menu to set the CAN bus mode to "J1939 mode" and register the polling configuration as required by the user. Click 'UPDATE' to save your settings.
(Note that all other interfaces like Modbus and BLE can also run concurrently).

Next, click “Upload iotasset.txt” button and in the new window, use the 'CHOOSE FILE' tab to select the above prepared file from your local folder to to send over to nodeG5. After the upload is successful you will need to close the page and log in again for security purpose. The user can also confirm the status of iotasset.txt file upload by clicking on Diagnostics::Check File.

After these settings are updated, REBOOT the gateway. The user can then check the CAN BUS vehicle data collected (Diagnostics::JSON Data) or delete for testing.
3E. Set up the gateway's Azure Hub IoT Client
Click the <IOT Client> tab in your web configuration menu and create a DeviceID for this gateway.
How you name this ID is up to you but make it distinct so you can identify it easily later.
Select the ENABLE option and confirm your settings by clicking the UPDATE button.
Save your settings by going to the <MANAGEMENT> tab to reboot the gateway.

4. Connect the collected data to your Azure IOT Hub account
Now that the connectivity between the ECU Simulator and the nodeG5 gateway has been set, we will then look at getting the data onto a designated Azure IoT Hub account.
We also support an open customer software and 3rd party API (e.g. REST API for HTTP, HTTPS and MQTT) integration to connect to a chosen cloud data or dashboard service (or to use for on board data processing).
4A. Setting up the Azure IoT Hub account
Go to https://azure.microsoft.com/en-us/pricing/purchase-options/pay-as-you-go/ to create a pay as you go account.
After signing in, give your account a name then click "Review + Create"

4B. Create a Resource Group
To create a new resource, a good way is to use the search toolbar to query "IOT Hub" then choose the subscription that we just set up. Create a Resource Group, new IOT Hub Name, Region & Tier then click "Review + Create" again.

4C. Add a new device & getting your connection string
Next, we want to add the nodeG5 edge IIoT gateway as a new device in this resource group.
To do that, first go back to your IOT Hub. Then select 'Devices' & add a new device.
Give your new device the same name that was created in step 3E and save it.


Find the device that you have just created & copy its connection string.
Open a notepad app. Paste this connection string in it and save the file as "connstr.txt".


4D. Linking your nodeG5 gateway to Azure using the connection string
Using a program such as winscp we are able to add the "connstr.txt" file to the /user directory of the nodeG5.
The default settings are as follows & password is node12345.


It's good to test your settings so far to ensure your data is received in Azure.
To do this open Powershell by clicking on this icon in Azure. Add some storage if it is necessary.

Run the following command (note: replace 'Your HUBNAME' with the name of the IOT Hub you created earlier):
az iot hub monitor-events --hub-name 'Your HUBNAME' --output table
Install the azure-iot extension, and you should see an output similar to the one below:

5. Create a Stream Analytics job
5A. Set up Stream Analytics
Start by searching for 'Stream Analytics' in Azure and creating a new job.

Select the appropriate resource group/ region and give it a name. Review and create when done.

5B. Mapping out the job topology
We will now build the job topology. Under your new analytics job select "Inputs" > "Add Input" > "IOT Hub".
Save your settings when you are done.


Now to add the job output, go to "Outputs" > "Add Output" > "PowerBI".
Give the dataset and table a name and save it when you are done.


Now to add the job output, go to "Outputs" > "Add Output" > "PowerBI".
Give the dataset and table a name and save it when you are done.
6. Visualise on Power BI
6A. Create a report in PowerBI
Create or log into your PowerBI account. Please ensure that Stream Analytics is running and your nodeG5 gateway is switched on.
Once logged in to your account, go to <MY WORKSPACE> and create a new dashboard using the <+ Create> tab & give your new dashboard a name.

Once the dashboard is created, go to <Datasets> and select the dataset which you have created earlier in step 5B.
Then check on the pencil icon to edit the Date & Time to your required time zone.

Go back to <My Workspace> and click the <+Create> again to create a new report. Choose the dataset that you have just created.
Play around with the different graph settings to create the report that you will like. You can reference our sample below for the checkbox settings we use to create our graphs. (We used an area graph to plot the value of 2A_CH1 against Time.)

Once done save your report with the <SAVE> tab and pin a live page on the dashboard you have created.

You can continue adding for various keys to your dashboard. To view your report go to <Workspaces> & select your Dashboard.


Congratulations! You have successfully set up the data reporting from your device, streamed it through AZURE IoT Hub and visualized it onto PowerBI.
7. Create Cloud-to-Device controls
The nodeG5 edge IIoT gateway can be configured to receive control messages from Azure IoT Hub (or other cloud back-ends) to control Modbus or CAN bus connected field devices like PLCs, motor inverters or EV chargers.
This demo application explains the sending of a control string from Azure CLI to simulate a cloud application or dash board widget.
The data is sent over 4G/Ethernet/WIFI, securely received by the gateway and written to Modbus/CAN Bus registers of connected devices.
7A. Send Modbus or CAN Bus control message from Azure IoT Hub to the G3 Gateway
From your Azure console, start the CLI PowerShell.
Run the az extension add command to add the Microsoft Azure IoT Extension for Azure CLI to your CLI shell.
az extension add --name azure-iot
Then you can configure your cloud to devices send command string
az iot device c2d-message send -d simDevice --data "device_tag" --props "key0=value0;key1=value1" -n{YourIoTHubName}

At your nodeG5 gateway, if the C2D Azure function has been enabled the following process would be executed and in this case, Modbus register(s) in PLC.2 written.

Congratulations! You have successfully set up the data reporting from your device, streamed it through AZURE IoT Hub and visualized it onto PowerBI & created bi-directional message controls to your device from your cloud solution.
Thank you and we look forward to working with your team!
Got a question for us?
Contacts:
Tech Support : support@amplified.com.au
Sales : sales@amplified.com.au
Amplified Engineering